Reading Belgian Smart Meters via P1 Port and Transmitting Data over LoRaWAN
I have recently moved into a new house in Wallonia, Belgium, equipped with a solar installation (Huawei SUN2000-3K-LB0 inverter). Before moving in, I wanted to build a monitoring system that would help me understand my consumption patterns and be ready to diagnose potential inverter shutdown issues caused by grid over-voltage, a common problem in areas with high solar penetration.
For that purpose, I have built an Arduino-based system that reads the electrical meter’s P1 port and transmits aggregated data over LoRaWAN every 15 minutes. In my old house, I used it to analyze my consumption patterns, but the code was already prepared to detect the over-voltage conditions that can trigger inverter protective shutdowns.
The full source code is available on GitHub.
The Challenge: Understanding Consumption and Preparing for Solar
Belgian smart meters expose a wealth of data through their P1 port. I wanted to:
- Monitor consumption patterns: Understand when and how much electricity I use
- Prepare for solar production monitoring: Track production once I move in
- Be ready for over-voltage detection: In Belgium, grid-connected inverters must comply with Synergrid C10/11 and EN 50549-1 regulations, which require inverters to disconnect when:
- Stage 1: Sustained over-voltage: Grid voltage exceeds 253V (1.10 × 230V nominal) for more than 1.5 seconds
- Stage 2: Extreme over-voltage: Grid voltage instantaneously exceeds 264.5V (1.15 × 230V nominal)
Once triggered, the inverter waits approximately 60 seconds of stable voltage before reconnecting. This leads to lost production and reduced rentability.
Spoiler: my new house does not suffer from this issue, it was the case in my old house (but that house did not have solar panels).
The Solution: P1 Port + LoRaWAN + Environmental Monitoring
Belgian smart meters (ORES in Wallonia, Fluvius in Flanders) expose a P1 port that outputs detailed electrical data every second. The challenge? LoRaWAN’s duty cycle limitations don’t allow transmitting every second, but its low power consumption and long range (100m+) make it perfect for remote monitoring. Its long range allows usage for meters in a basement when the access point can be on the third floor, useful if you live in an apartment.
My solution: aggregate the per-second data and transmit a summary every 15 minutes, along with temperature and humidity readings from a DHT22 sensor.
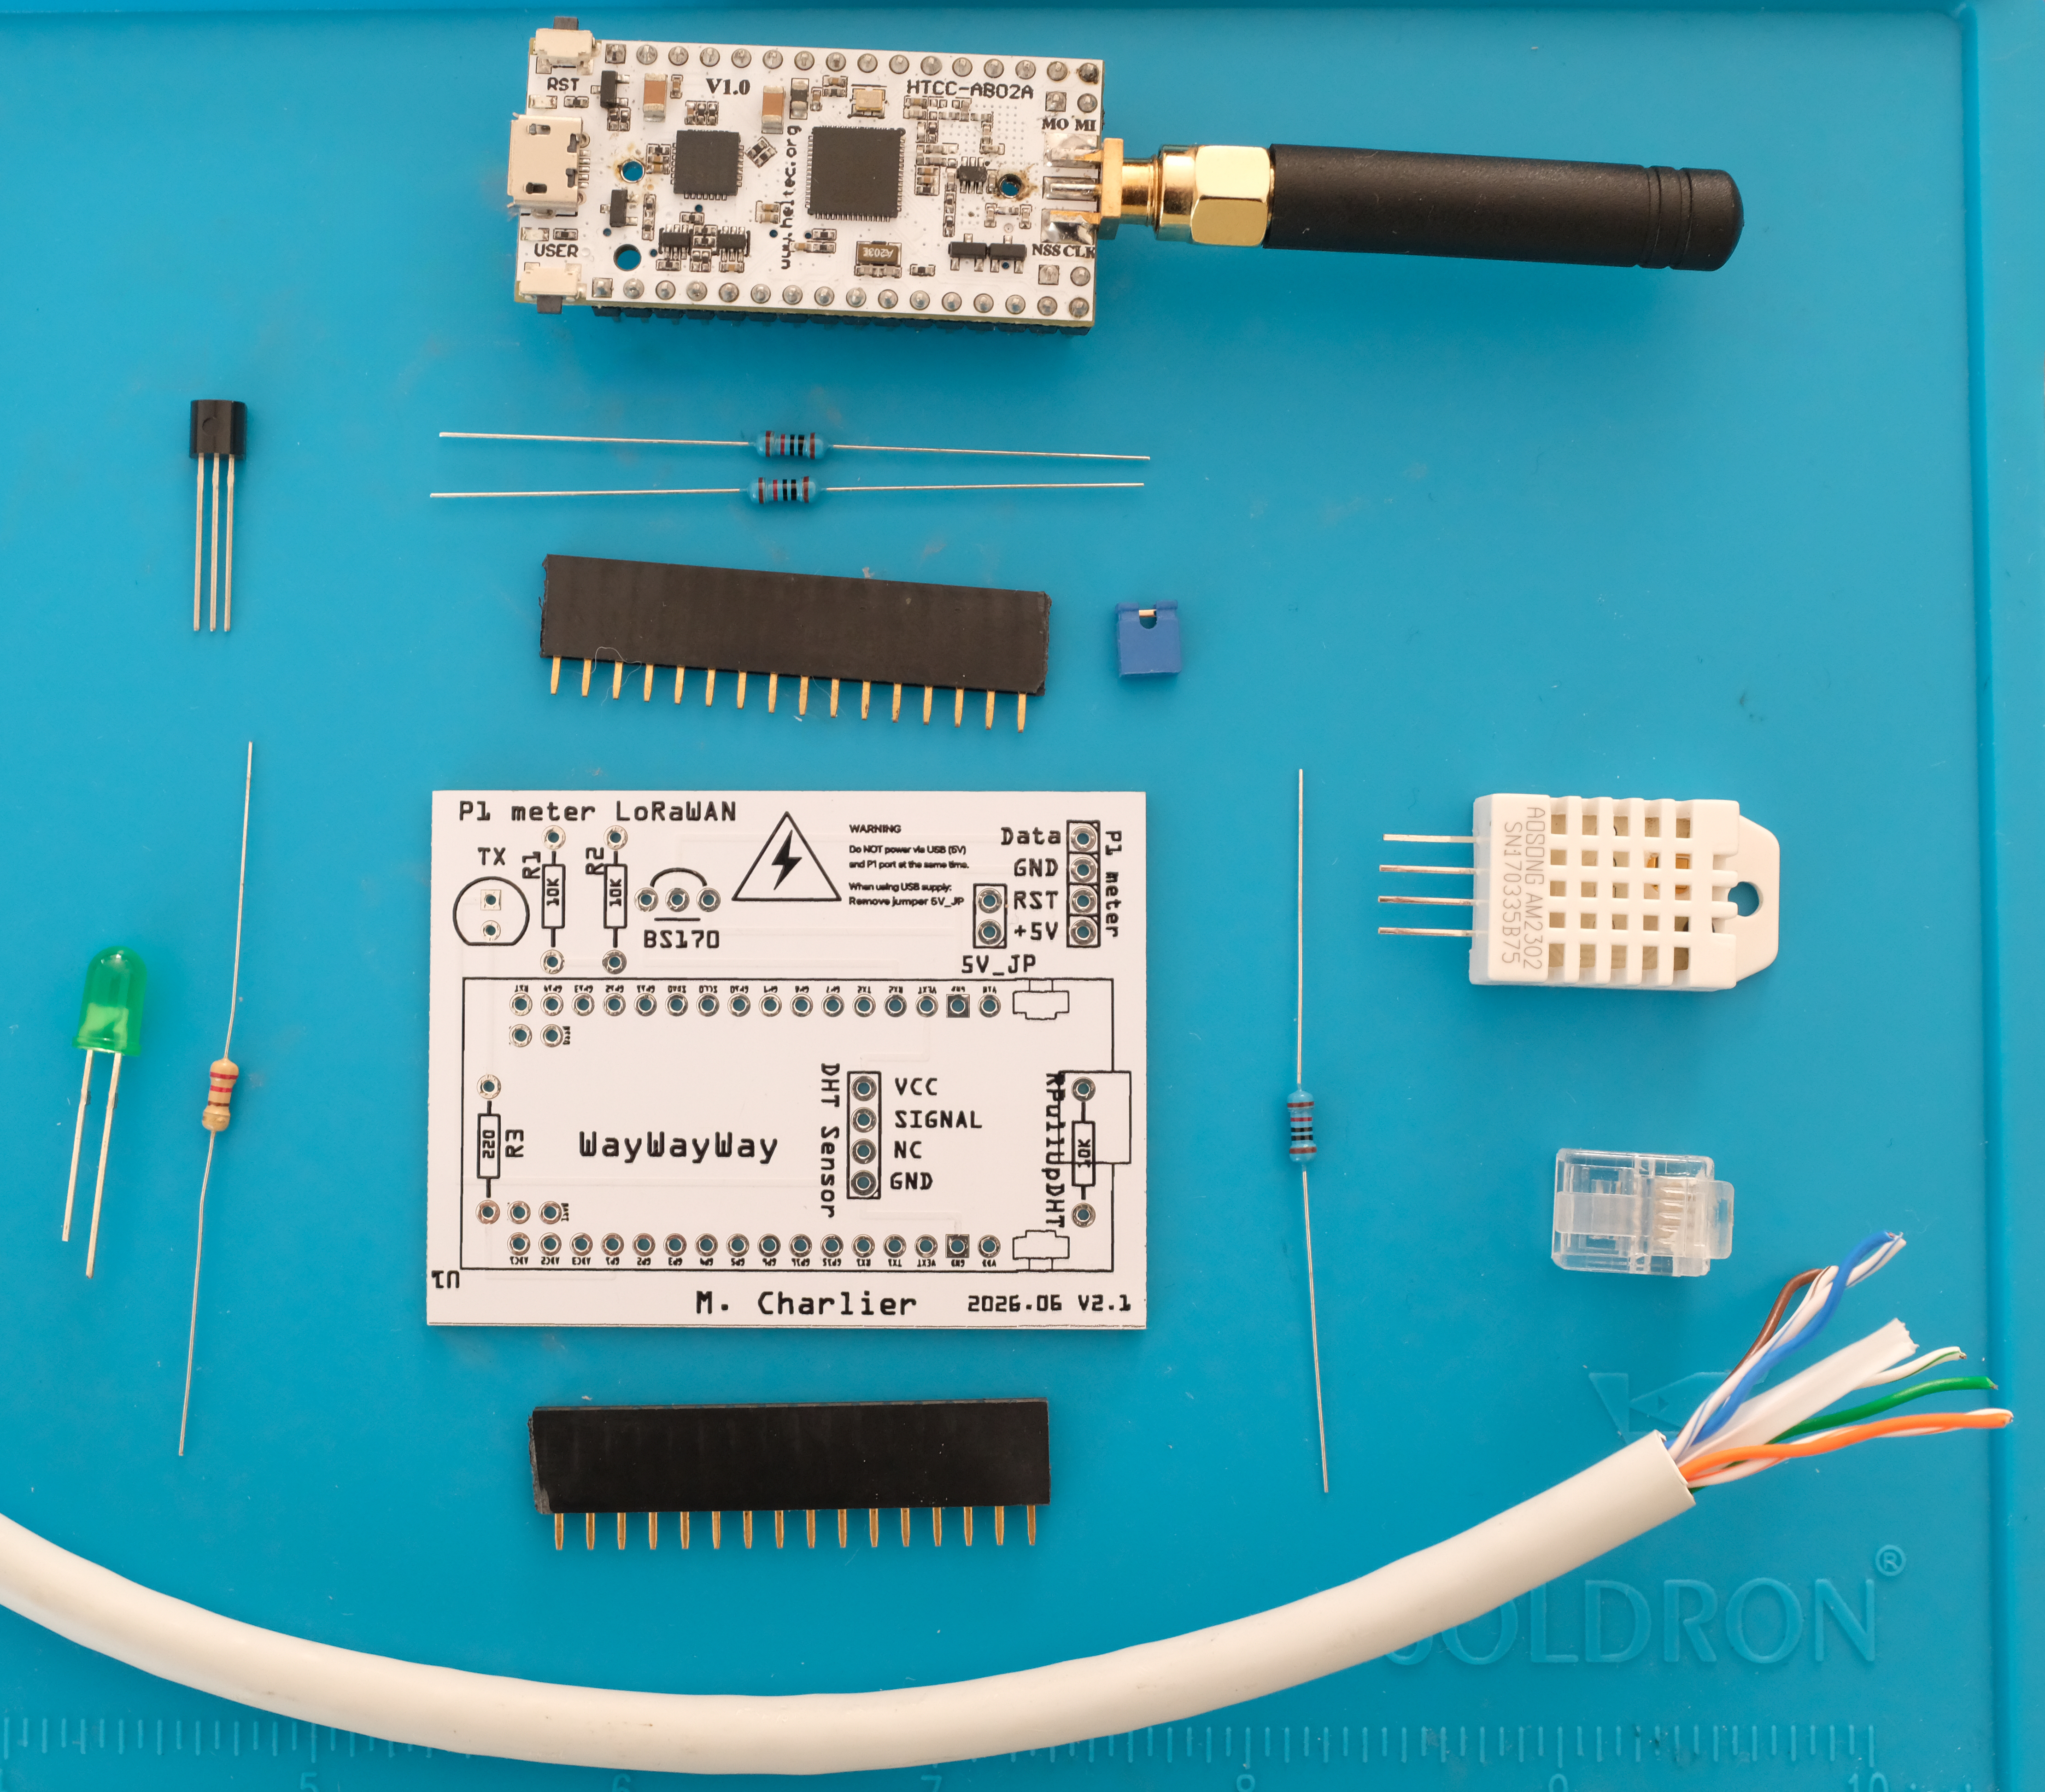
Hardware Setup
Components
- CubeCell 1/2AA Node (HTCC-AB02A): An Arduino-compatible LoRaWAN device with two hardware serial ports
- BS170 MOSFET: For signal level conversion and inversion
- RJ11 connector: To connect to the meter’s P1 port
- DHT22 sensor: For ambient temperature and humidity monitoring
The Signal Challenge
The P1 port uses inverted 5V serial (5V = logic 0, 0V = logic 1), while the Arduino expects standard 3.3V serial. The BS170 MOSFET elegantly solves both problems:
- 5V from the meter → 0V (GND) on Arduino
- 0V from the meter → 3.3V on Arduino (pulled high by GPIO)
The Arduino is powered directly from the meter’s 5V line, and the P1 data request line is held high to enable continuous data output.
Electrical Meter P1 Port          Arduino CubeCell
        5V  ──────────────────────→  VIN (Power)
       GND  ──────────────────────→  GND
      Data  ────┬─────────────────→  Serial1 RX
                │
            BS170 MOSFET
            (Signal Inverter)

DHT22 Sensor
      VCC   ──────────────────────→  3.3V
      GND   ──────────────────────→  GND
      DATA  ──────────────────────→  GPIO9 (with 10kΩ pull-up)
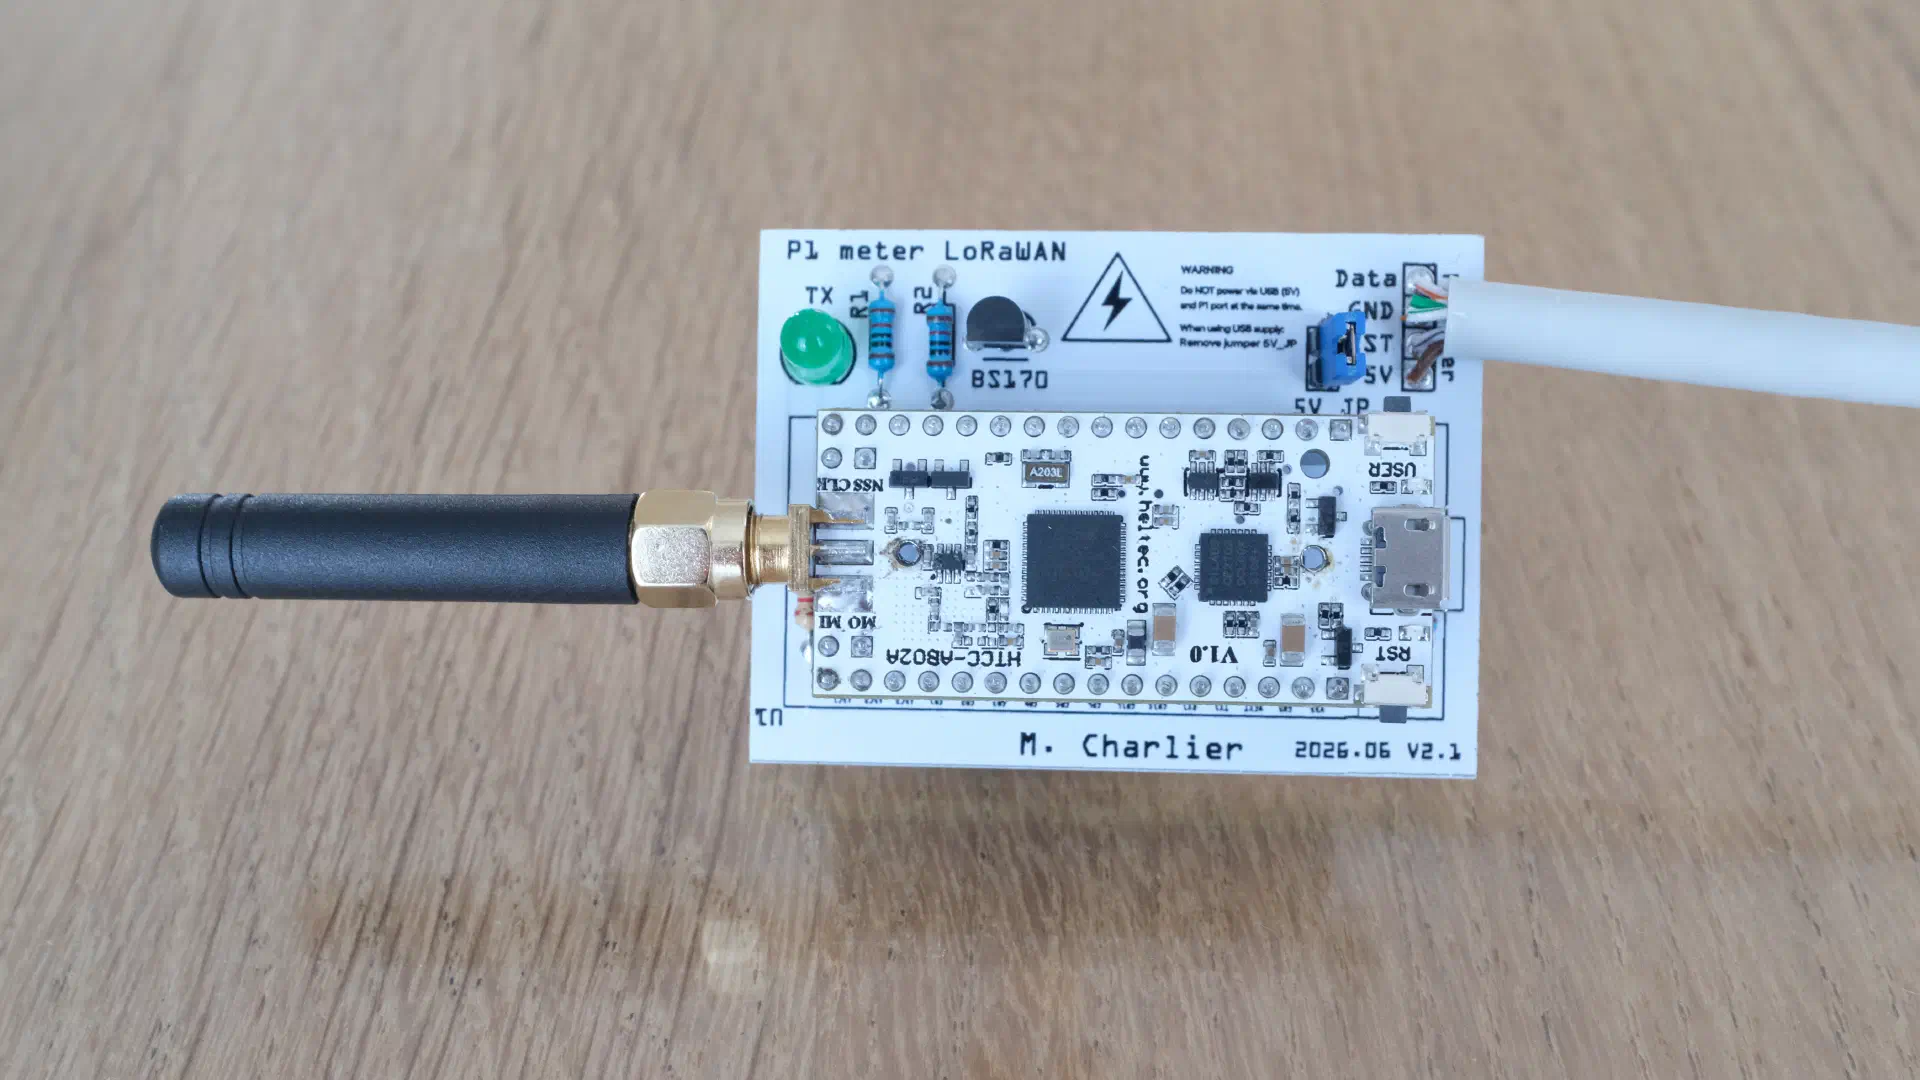
Assembled PCB
| Front | Back |
|---|---|
 | 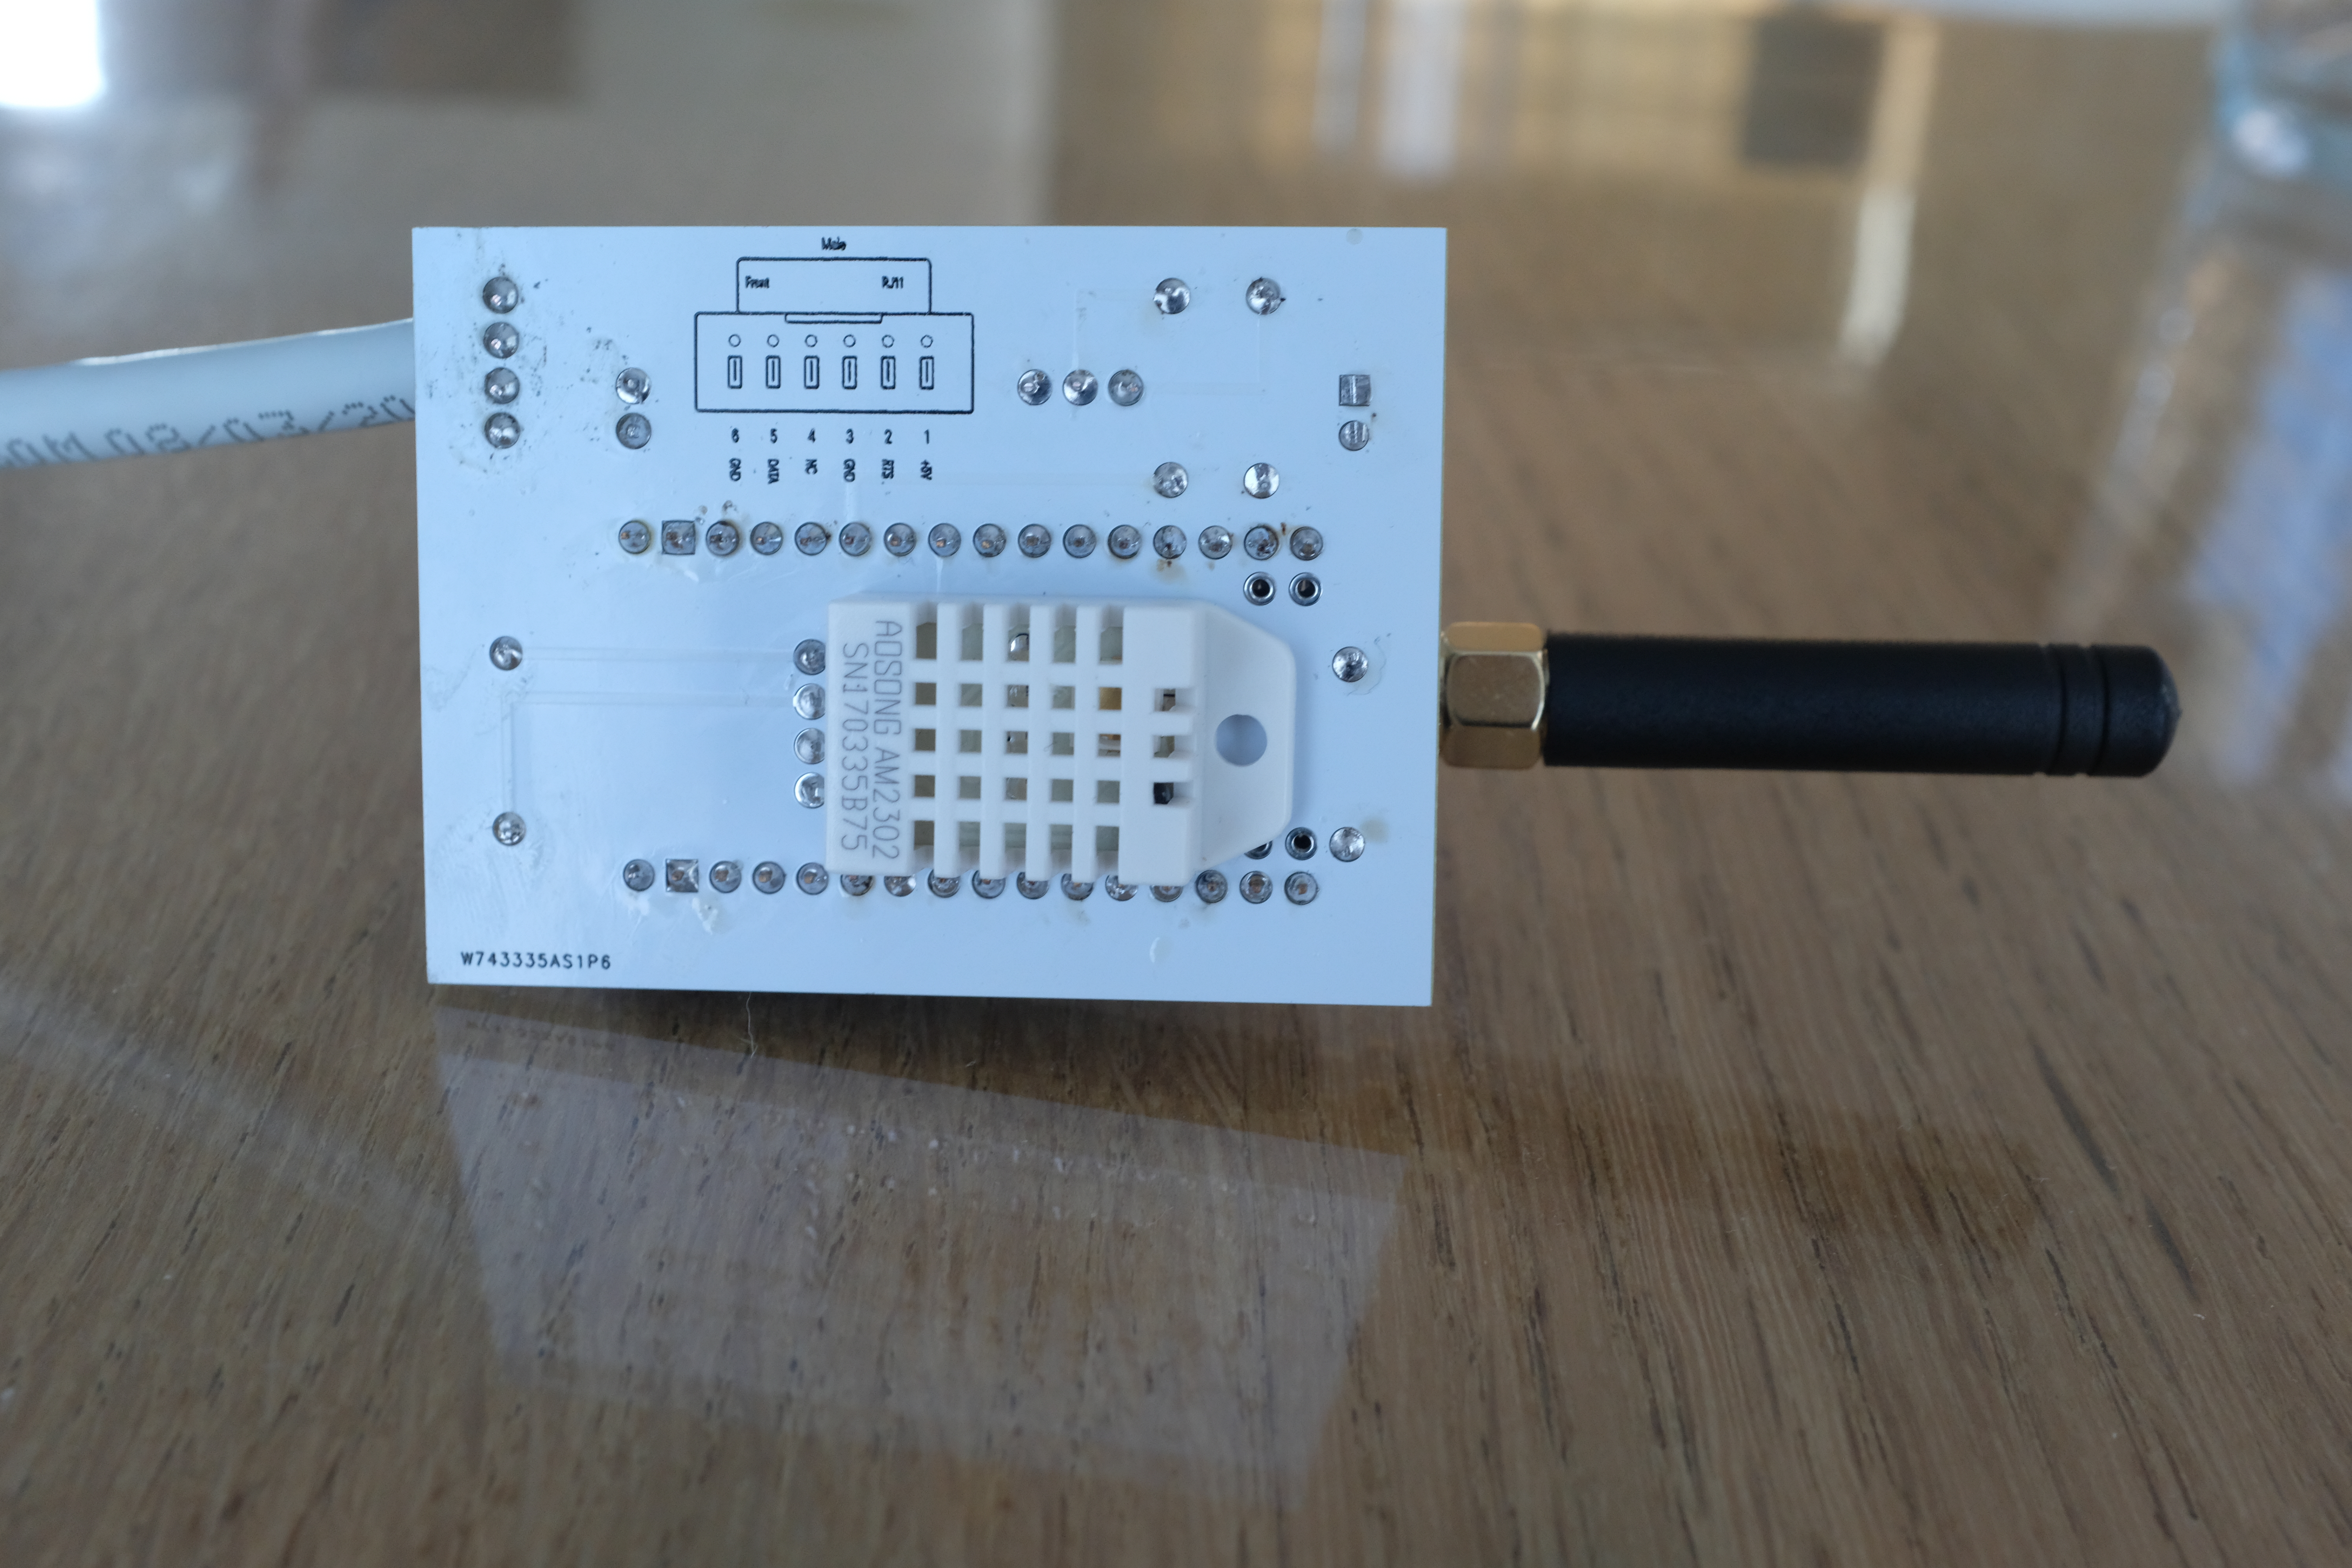 |
Software Architecture
Parser: Standing on Giants’ Shoulders
The telegram parser is adapted from Maarten Pennings’ eMeterP1port project. It handles the P1 telegram format, including CRC validation.
A typical P1 telegram from a Belgian meter looks like:
/FLU5\253770234_A

0-0:96.1.4(50217)                           // Version
0-0:1.0.0(240904223307S)                    // Timestamp
1-0:1.8.1(000328.928*kWh)                   // Consumption Tariff 1 (Day)
1-0:1.8.2(000312.703*kWh)                   // Consumption Tariff 2 (Night)
1-0:2.8.1(000000.035*kWh)                   // Production Tariff 1
1-0:2.7.0(00.000*kW)                        // Current production
1-0:32.7.0(238.7*V)                         // Voltage L1
1-0:31.7.0(001.21*A)                        // Current L1
!E4C7                                       // CRC
Aggregation: Making Every Byte Count
Since I can only transmit every 15 minutes, I aggregate the 900 samples received during that period:
| |
For each measured value (consumption, production, voltage, current), I track:
- Minimum: Lowest value in the 15-minute window
- Maximum: Highest value (critical for voltage monitoring!)
- Mean: Average calculated from sum/samples
- Sample count: For data quality verification
We expect 900 samples per period but some can be lost (the Arduino can be busy and unable to read the serial buffer in time). The number of samples per transmission varies between 880 and 900, a reduction can also signal a bad connection.
Over-Voltage Detection (Synergrid C10/11 Compliant)
The key feature for my use case: detecting when voltage exceeds the regulatory thresholds that trigger inverter shutdown.
| |
The code tracks:
- Total samples over 253V: How much time was spent in the danger zone
- Total samples over 264.5V: Instant trip events
- Maximum consecutive samples over 253V: If ≥2 consecutive samples (1 sample/second), the inverter likely tripped
Temperature and Humidity Monitoring
A DHT22 sensor provides environmental data, useful for correlating electrical behavior with ambient conditions. The readings are encoded in just 2 bytes:
| |
To decode: temperature = (byte / 2.0) - 40.0
LoRaWAN Payload Format (v2)
Every byte matters in LoRaWAN. My 62–68 byte payload packs:
| Field | Size | Description |
|---|---|---|
| Frame version | 4 bits | Protocol version (2) |
| User button | 1 bit | Manual trigger flag |
| Phases | 2 bits | Number of phases (1) |
| Timestamp | 32 bits | Unix timestamp (UTC) |
| Consumption indexes | 2×32 bits | Day/Night in Wh |
| Production indexes | 2×32 bits | Day/Night in Wh |
| Tariff indicator | 8 bits | Current tariff |
| Sample count | 16 bits | Data quality |
| Consumption stats | 72 bits | Min/Max/Mean (W) |
| Production stats | 72 bits | Min/Max/Mean (W) |
| Voltage stats | 72 bits | Min/Max/Mean (decivolts) |
| Current stats | 72 bits | Min/Max/Mean (centiamps) |
| Temperature | 8 bits | DHT22: (val/2)-40 = °C |
| Humidity | 8 bits | DHT22: 0–100% |
| Stage 1 over-voltage count | 16 bits | Samples >253V (optional*) |
| Stage 2 over-voltage count | 16 bits | Samples >264.5V (optional*) |
| Max consecutive Stage 1 | 16 bits | Longest streak (optional*) |
*Over-voltage fields are only included when Stage 1 count > 0, saving 6 bytes in normal operation.
Transmission Timing
To avoid all devices in a neighborhood transmitting simultaneously at quarter-hour boundaries, I add a random delay:
| |
Timestamp Handling
Belgian meters report time in local format with a timezone indicator (S=Summer/CEST, W=Winter/CET). The conversion handles all edge cases including month/year rollover:
| |
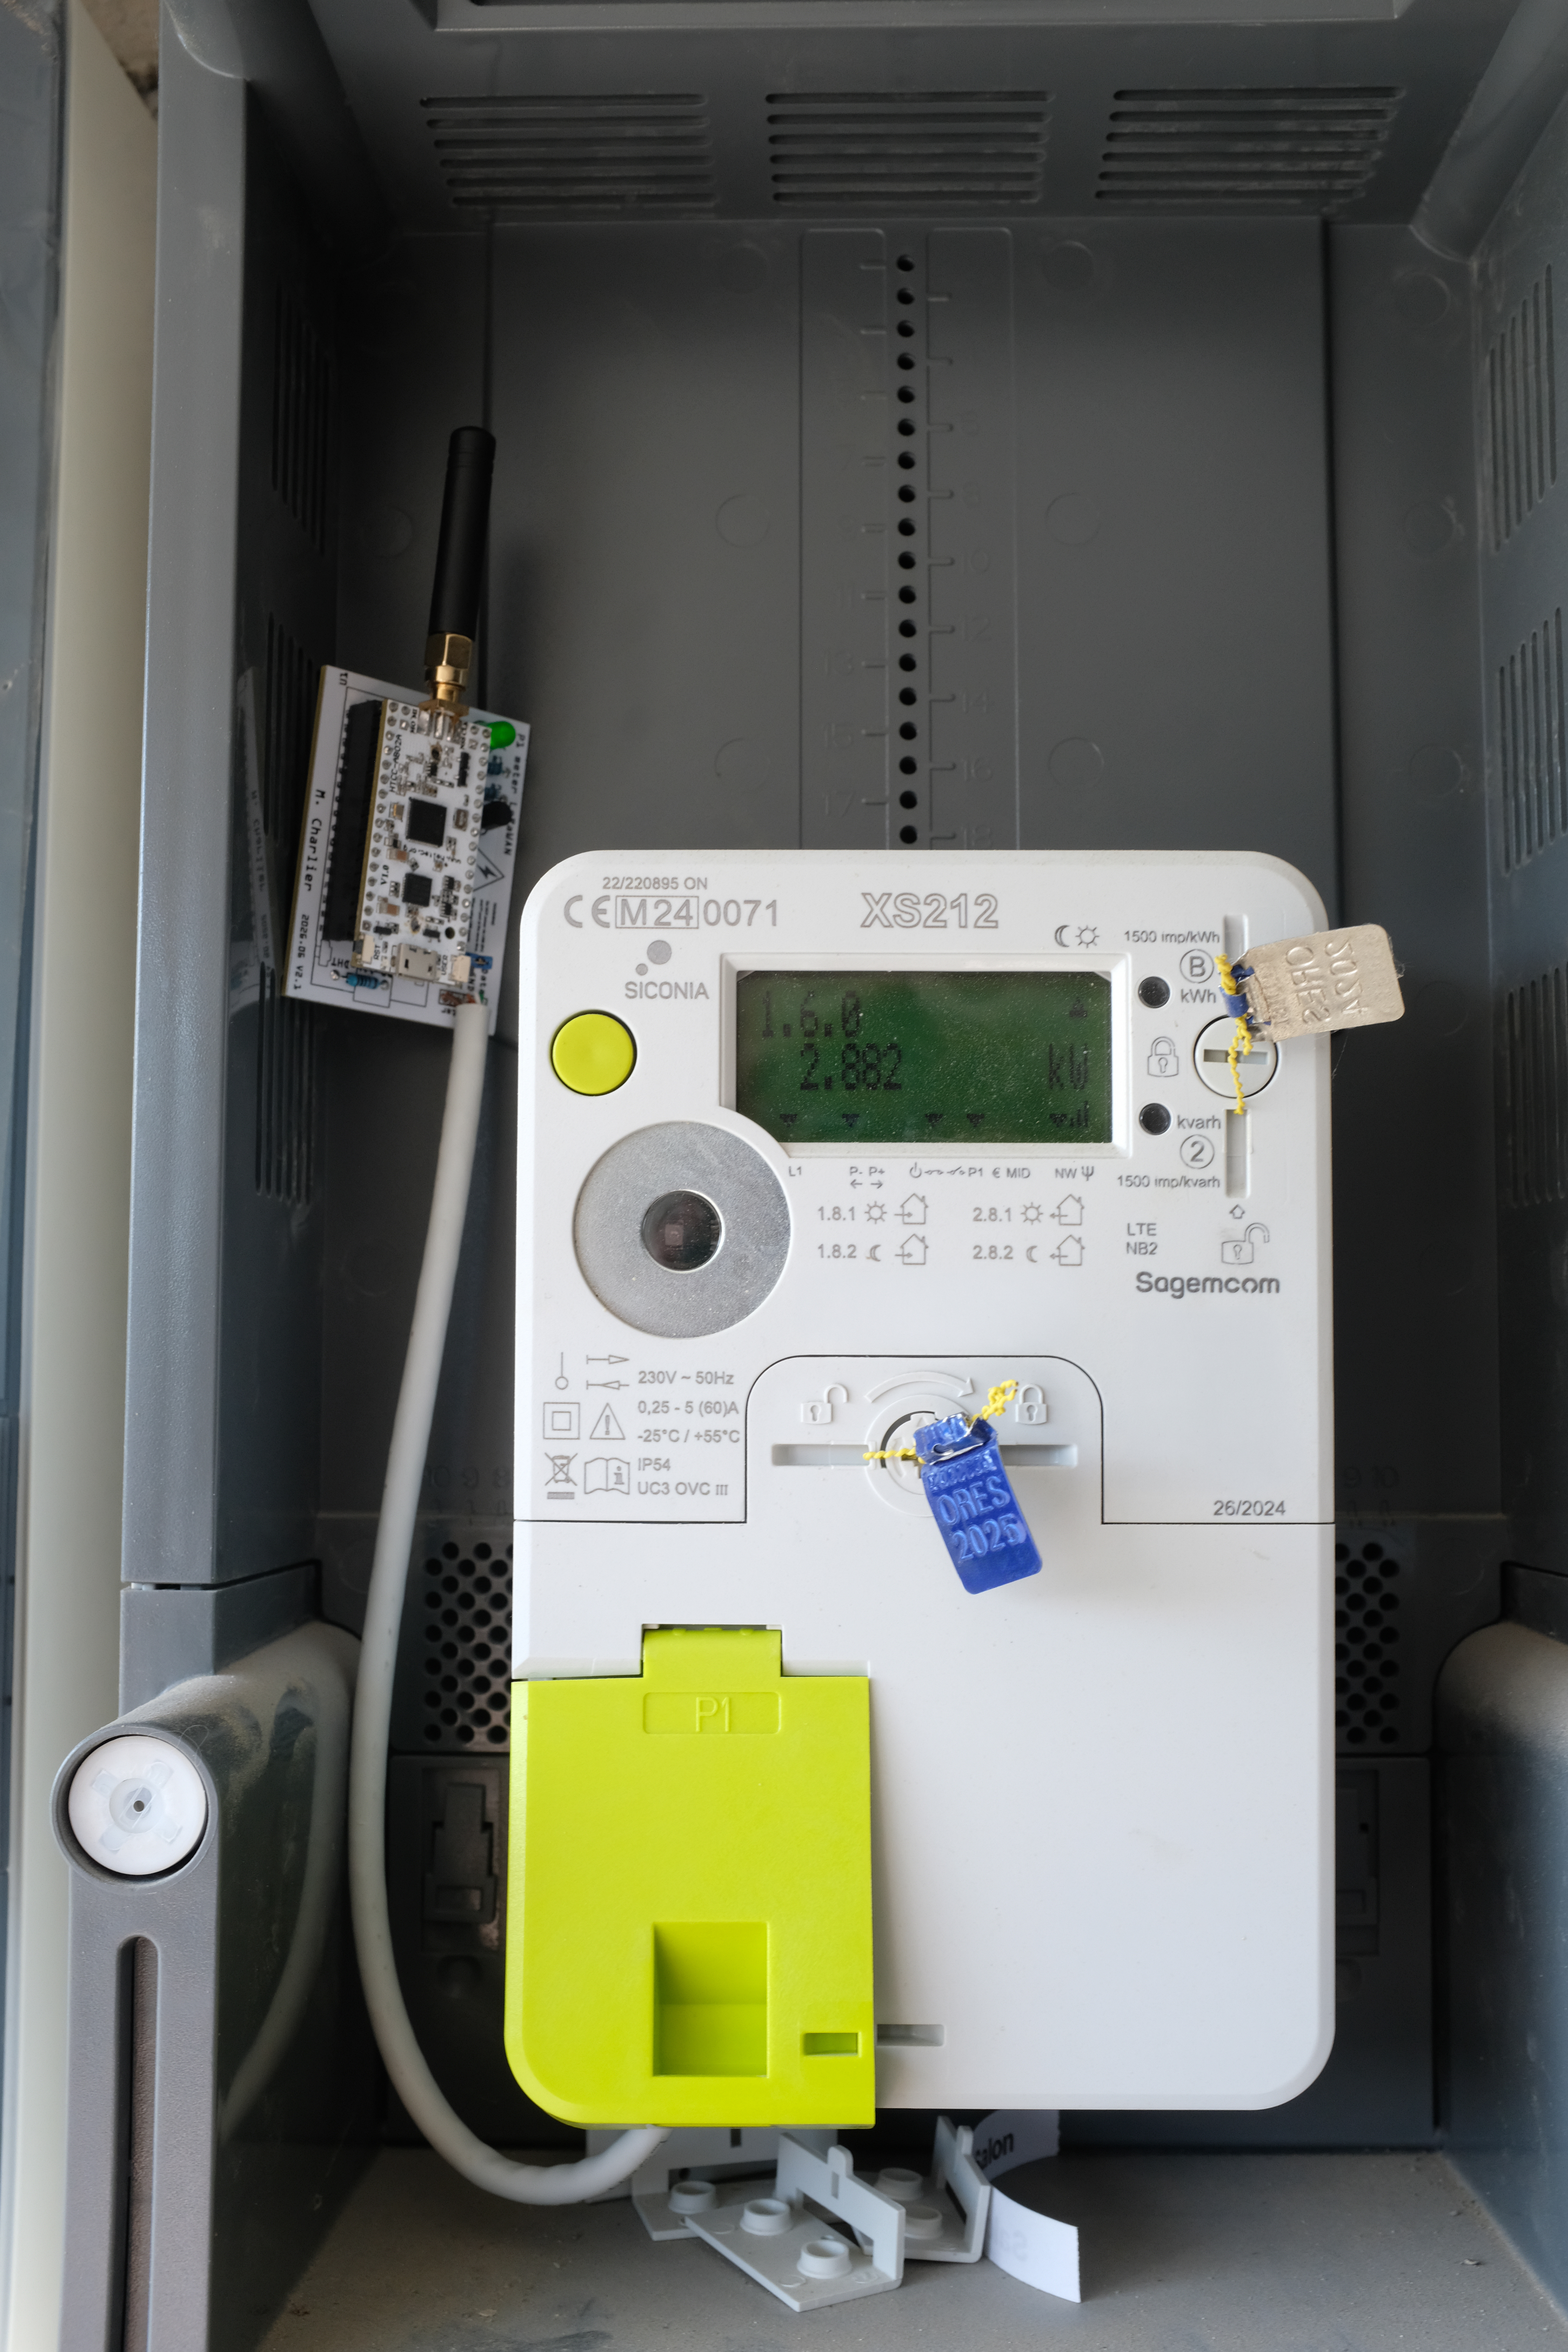
Results and Insights
With the sensor installed on the electrical meter, I can now collect real data:
The Grafana dashboard surfaces both index readings and instantaneous consumption:
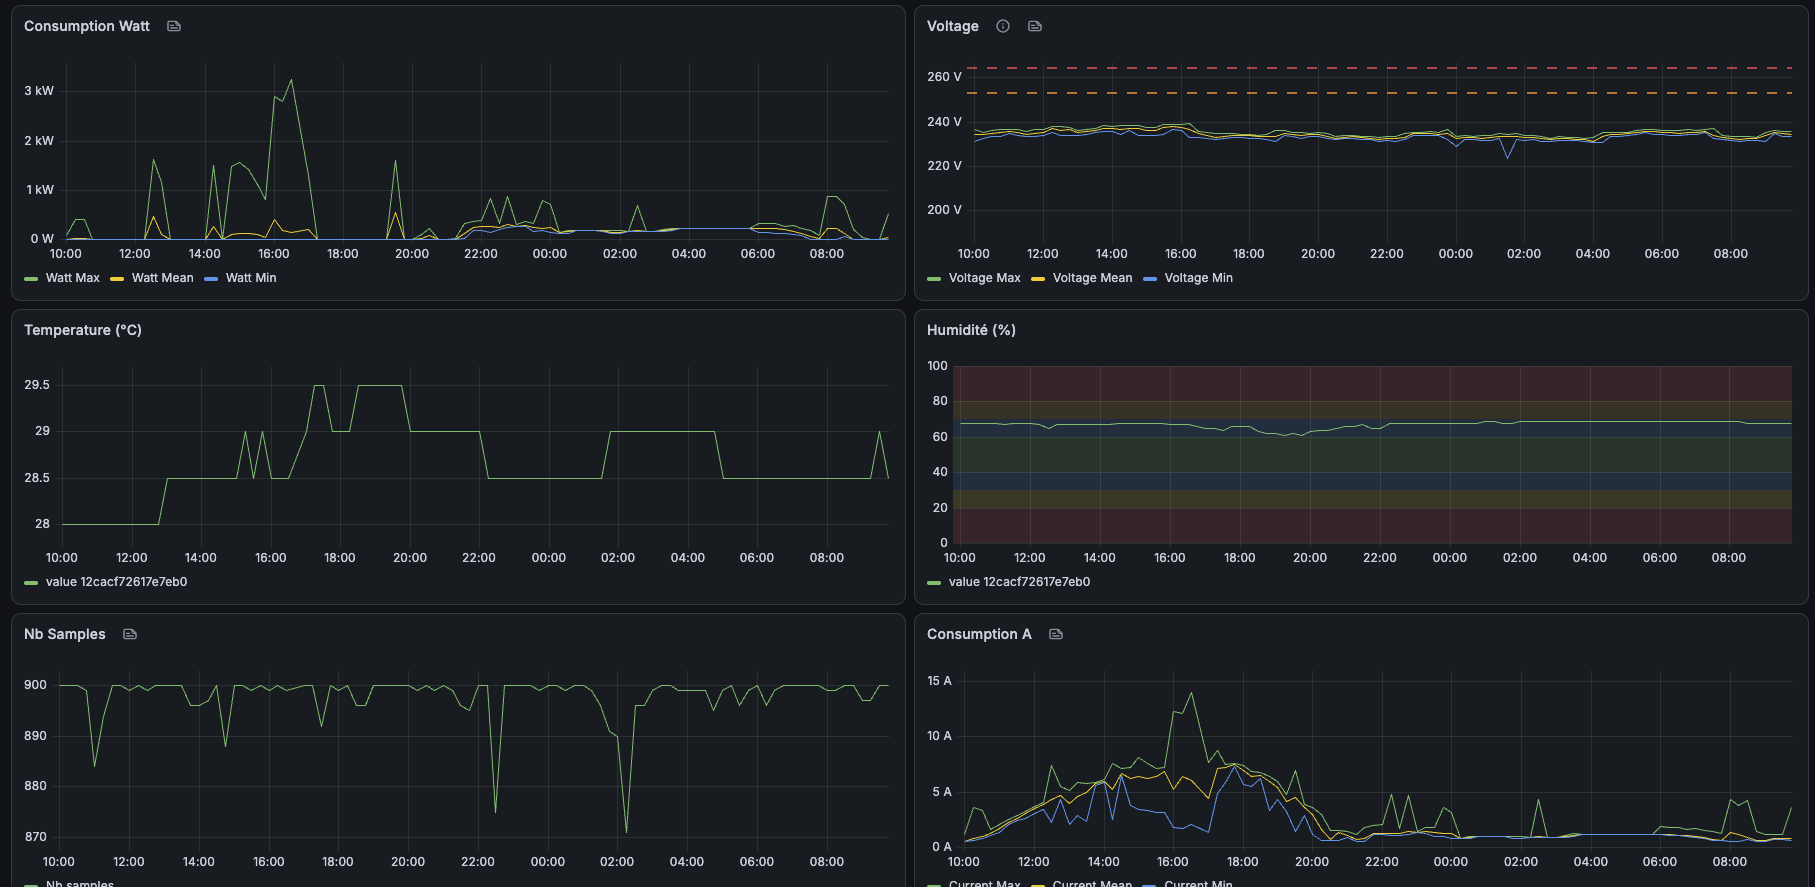
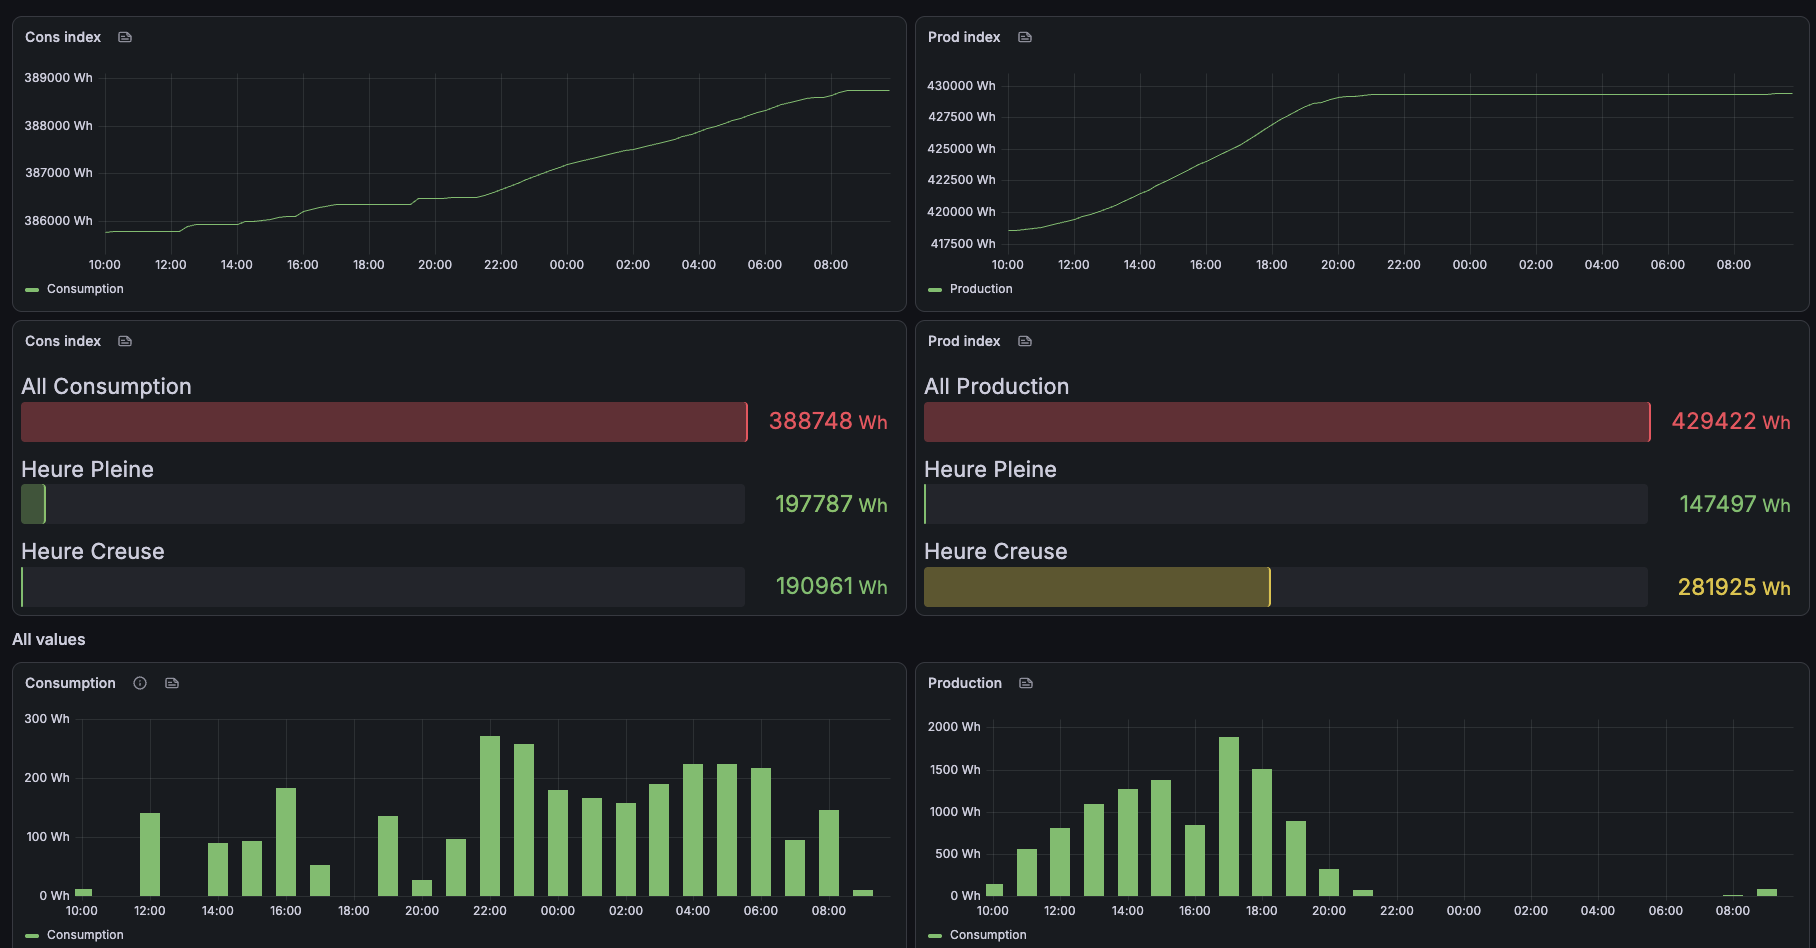
With this system deployed, I can:
- Analyze consumption patterns: Understand my electricity usage throughout the day and identify peak consumption periods
- Track voltage patterns: Monitor grid voltage stability and see when spikes occur
- Detect over-heating: The temperature sensor helps detect overheating inside the electrical panel
- Be prepared for solar: The system immediately starts tracking production and detecting potential over-voltage issues
- Document issues for DSO: If problems occur, I have concrete, timestamped data to share with my distribution system operator
The 15-minute resolution with min/max/mean gives enough detail to understand patterns without overwhelming the LoRaWAN network.
An unexpected but very practical benefit: when I am away on holiday, I can verify that consumption looks normal. A sudden spike would indicate someone entered the house, and a flat zero would signal a power outage: I can then ask someone to check and restore power for the refrigerator.
Lessons Learned
- Use correct thresholds: Synergrid C10/11 specifies 253V and 264.5V, not the commonly cited 254.5V and 267V
- Track consecutive samples: Total count isn’t enough; you need to know if voltage stayed high continuously
- Signal inversion matters: The BS170 MOSFET solution is elegant and reliable
- Timestamps are tricky: Convert to UTC immediately to avoid DST edge cases
- Compact encoding saves bytes: DHT22 data fits in 2 bytes with acceptable precision
- Random delays help: Prevents network congestion at quarter boundaries
- Meter data alone isn’t enough with solar: You also need production values from the inverter to get a complete picture of consumption
Future Improvements
- Add gas meter reading (available on the P1 port) once a smart gas meter is installed
- Add an ESP32 connected via Wi-Fi to the Huawei inverter, reading production values over Modbus, to combine all readings into a single unified dashboard
Comments